Email Bounce Rate: How to Read, Calculate and Fix It
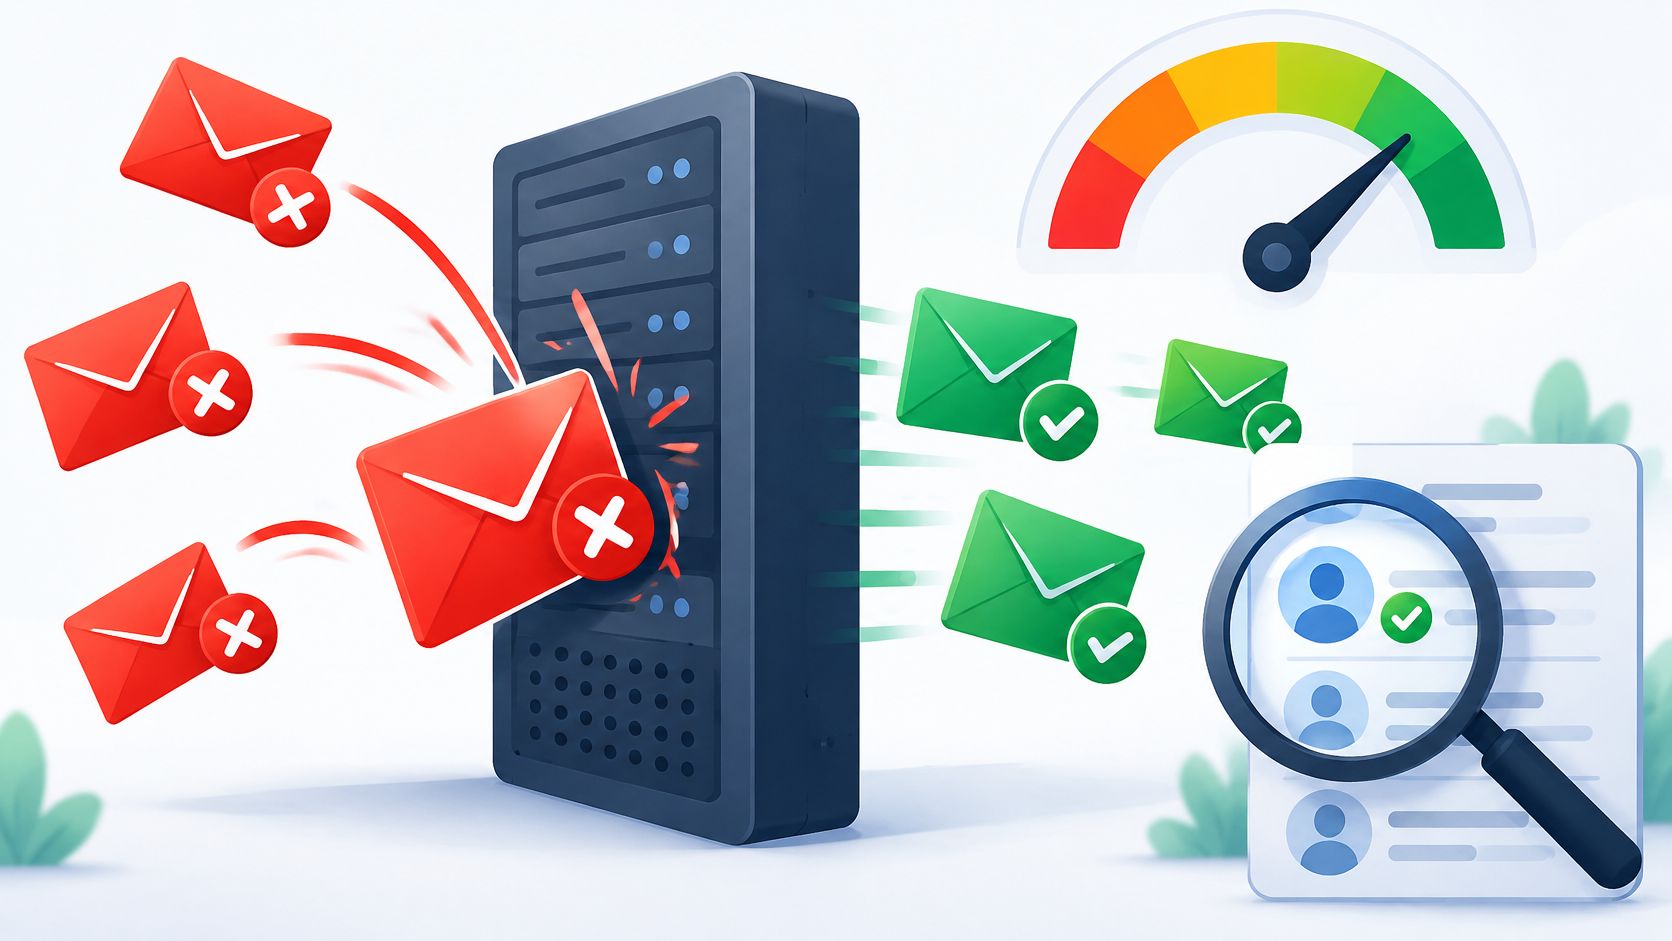
Email bounce rate is the number of bounced messages divided by the total number of messages sent, multiplied by 100. The popular rule is that anything under 2% is healthy and anything above it needs attention, and for one person sending one newsletter that rule holds up fine.
It collapses the moment several agents send from their own addresses. An account reading 1.2% can hide a single mailbox running at 6%, and the average tells you nothing about which workflow to stop. The number isn't the problem. Reading it as one number is.
Every bounce is a failed handoff, and each one carries information about the address, the domain or the way the send was made. Grouped by agent and by cause, those signals point at a specific fix. Pooled into a daily percentage for the whole account, they point nowhere.
What follows is the arithmetic, the ranges worth comparing against, and the split that turns one figure into something an operator can act on before an unattended agent damages a sending domain.
Table of Contents
- Email Bounce Rate Ranges and What They Mean
- How to Calculate Bounce Rate with Worked Examples
- Hard Bounces and Soft Bounces Explained
- Why One Bounce Rate Hides Failing Agents
- Common Causes of Bounces and How to Fix Each
- Set Bounce Thresholds Before Your Agent Sends
Email Bounce Rate Ranges and What They Mean
The calculation is one line: bounced messages divided by total messages sent, multiplied by 100. The interesting part is what you compare the result to.
| Rate or reference | What it represents | How to read it |
|---|---|---|
| Under 2% | Typical for an established, well-maintained list | Healthy, keep monitoring the trend |
| 2% to 5% | Watch zone for list age, sources and provider blocks | Audit recent sources and suppress permanent failures |
| Above 5% | Serious warning for list hygiene and sender reputation | Pause sending and investigate before resuming |
| About 1.5% | Global permission-based benchmark | About 98.5% of messages delivered |
| 1.71% | 2025 analysis of more than 7.5 million B2B cold emails | Reference for cold outreach, not opted-in lists |
| 2.33% | GetResponse average for 2023 customer campaigns | Reference for email marketing campaigns |
| 10% | Salesforce B2B guidance describing anything below as good | Broad threshold, not a pass or fail line |
What the Reference Points Actually Measure
A permission-based benchmark puts global bounce rates at about 1.5%, implying that roughly 98.5% of messages are delivered rather than returned, according to the 2025 Benchmark Report. The same report notes that Salesforce guidance treats anything below 10% as a good bounce rate, a deliberately loose B2B threshold that says more about the accounts Salesforce serves than about yours.
Cold outreach reads differently. A 2025 analysis of more than 7.5 million B2B cold emails across 40+ industries and 70 countries reported a 1.71% overall bounce rate (2025 benchmark analysis). Older addresses, thinner consent and more aggressive targeting all push that figure up.
Platform averages land in the same band. GetResponse reported an average email bounce rate of 2.33% for customer campaigns in 2023 in its 2024 Email Marketing Benchmarks report.
These figures don't contradict each other. Each comes from a different audience, a different consent level, a different denominator and, in some cases, a different definition of what counts as a bounce. A transactional receipt and a cold prospecting email can share a percentage and mean entirely different things.
The comparison that matters: this mailbox's rate this month against the same mailbox's rate last month, not against a number pulled from somebody else's list.
Ranges only get you to the first question. For a wider set of campaign-level figures across channels and list sizes, sourced statistics on email campaigns gives more reference points to place a rate against.
Treat the table as a starting range and nothing more. The next step is splitting the number into the parts that tell you what to change.
How to Calculate Bounce Rate with Worked Examples
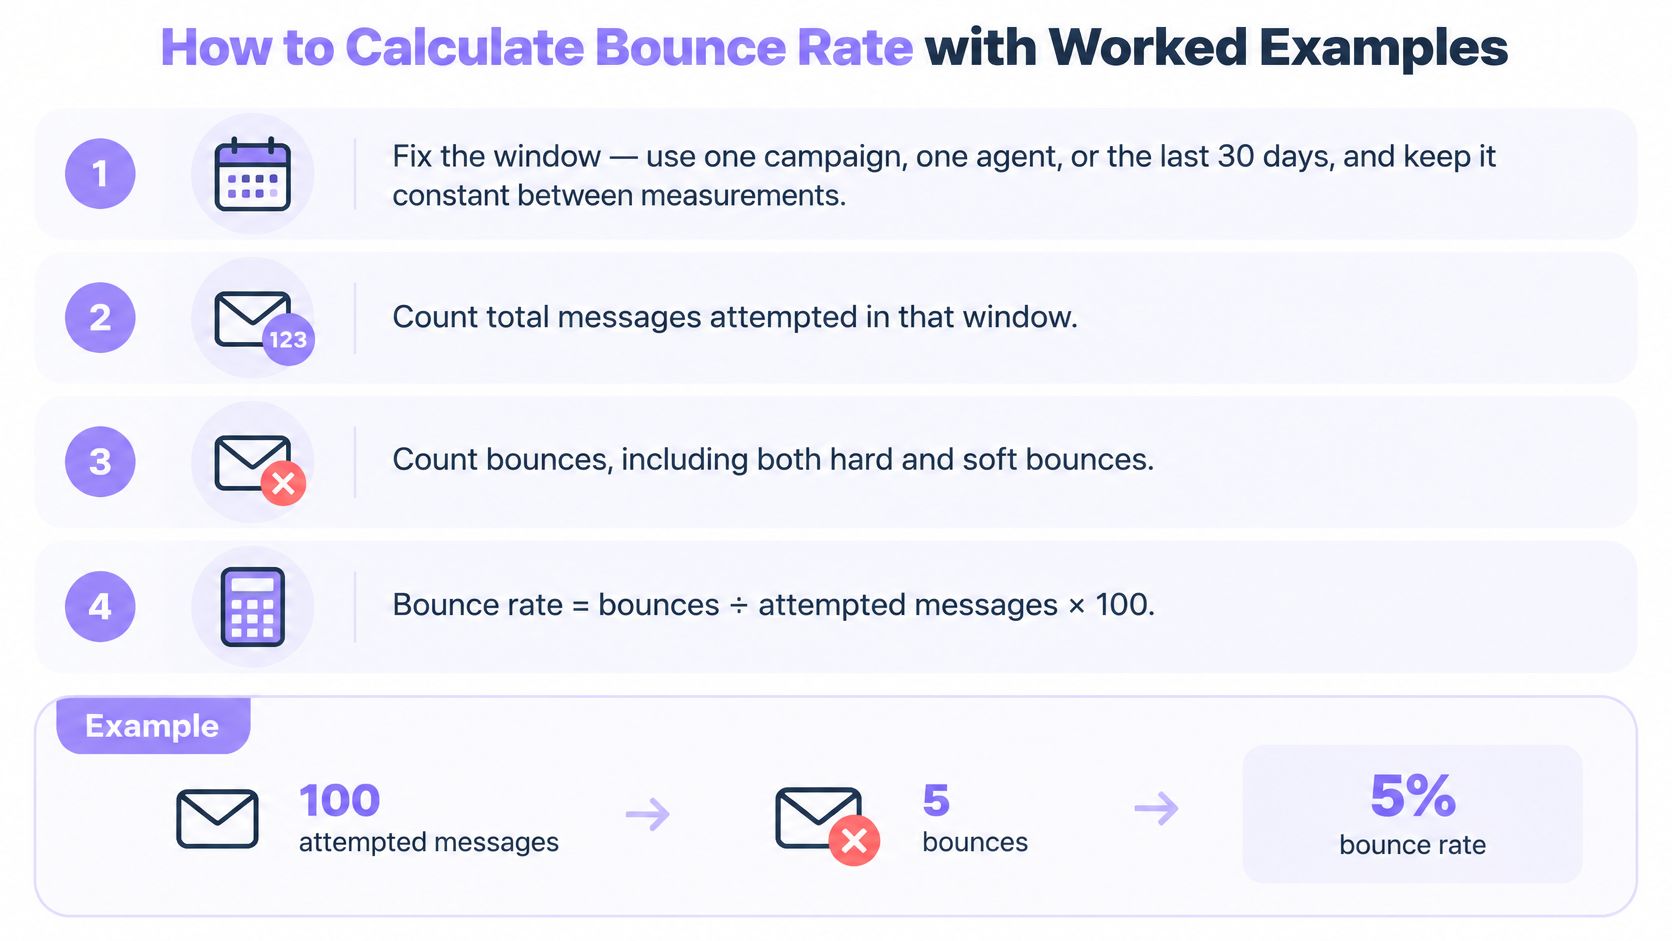
Four steps produce a figure you can defend in a code review.
- Fix the window. Pick one campaign, one agent or the last 30 days, and keep it identical between measurements. A rate from a quiet week and a rate from a launch week measure different things, so comparing them is noise.
- Count messages attempted. Include every message the system tried to hand to a receiving server, not only the ones that came back with a verdict. Dropping queued and deferred sends makes the denominator too small and the rate look worse than it is.
- Count bounces and split them. Record hard and soft separately wherever the sending system reports both. A combined count tells you how bad things are; the split tells you what to do about it.
- Divide and multiply. Bounces divided by attempted messages, times 100. Keep a few decimal places while you're comparing, round to one when you report.
The flow is short enough to keep in your head:
Worked examples show why the denominator has to travel with every rate you publish.
| Example | Bounces | Messages sent | Bounce rate |
|---|---|---|---|
| Small list test | 15 | 1,000 | 1.5% |
| Mid-size batch | 150 | 10,000 | 1.5% |
| Poor source batch | 400 | 10,000 | 4% |
| Large batch | 1,500 | 100,000 | 1.5% |
Three of those four rows read 1.5%. One is a small test, one is a routine batch and one is a hundred thousand sends. A percentage with no volume attached can't be audited, which is why the raw counts belong next to it.
The common slip is using delivered messages as the denominator instead of attempted sends. That inflates the rate, because every bounced message has already left the delivered set. The second slip is dropping retries from the count, which hides transient failures and makes a list look cleaner than it is.
If your delivery log starts each line with the SMTP reply code, one pass counts the classes:
awk '{print substr($1,1,1)}' replies.log | sort | uniq -c
The output gives a count for 2xx, 4xx and 5xx lines, so you can see how much of the total is permanent and how much is a retry waiting to happen. Recalculate the last 30 days for each agent mailbox and write the result beside the window you used. A number with no window can't be compared with anything later.
Hard Bounces and Soft Bounces Explained
A bounce is an email that cannot be delivered to the intended recipient, and the rate built from them is a delivery-quality metric rather than an engagement one. Hard bounces and soft bounces share that definition and almost nothing else (Salesforce bounce definitions).
What Makes a Bounce Hard or Soft
Hard bounces are permanent failures. The address doesn't exist, the domain is invalid, or the recipient's server rejects the message outright. They point at inaccurate or obsolete recipient data, and the right move is to take the address off future sends.
Soft bounces are temporary. A full mailbox, a mail server that's briefly unavailable, or a message larger than the recipient system allows. These often clear on an automated retry, so deleting the contact immediately throws away a real address.
Take a batch that lands at 4%. If most of those bounces are soft, the answer is retries and patience. Same rate, mostly hard bounces, and the list needs cleaning that day. The percentage is identical and the work is opposite.
Reading the SMTP Reply Code
The taxonomy maps cleanly onto the reply class, which is why the log matters more than the dashboard (email bounce rate by SMTP class).
- 5xx replies are permanent failures: a nonexistent recipient, an invalid domain, a policy refusal. Suppress the address at once, because retrying it wastes sending capacity and reputation.
- 4xx replies are transient: greylisting, throttling, temporary unavailability, a full mailbox. Give them bounded retries with exponential backoff, then suppress if the failure persists.
This is the framework RFC 5321 defines, and it exists so a sender can tell the difference between "this address is dead" and "this server is busy right now" without guessing.
The Two Traps
Temporary delays get mistaken for list-quality problems, so a perfectly good list is pruned during a provider's bad afternoon. The reverse error costs more: repeated attempts to invalid addresses worsen sender reputation, and reputation damage outlasts the bad list that caused it.
Track four things together, always with the window attached: hard-bounce rate, soft-bounce rate, retry outcomes, and the measurement period. Reported as a set, they sort last month's bounces into buckets you can act on separately.
For outbound teams working cold lists, bounce troubleshooting for B2B cold outreach works through the same split from a prospecting angle. And if transactional traffic shares infrastructure with outbound, transactional email API covers how to keep the two streams from contaminating each other's metrics.
Why One Bounce Rate Hides Failing Agents
A bounce rate under 2% is not automatically healthy.
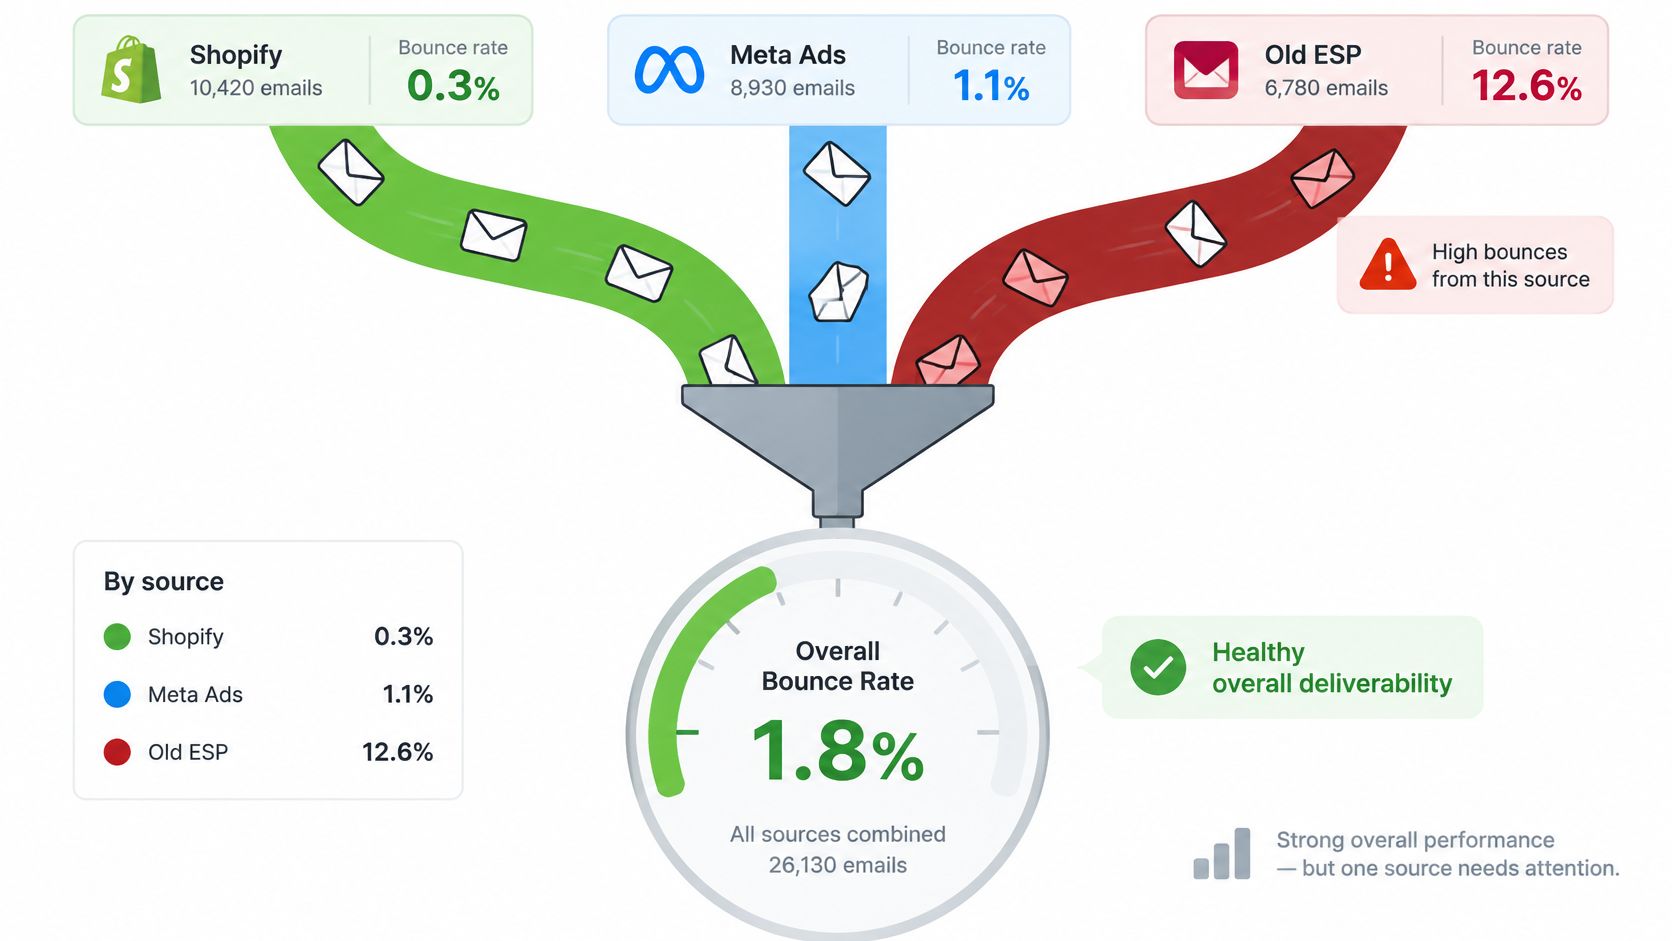
One aggregate figure conceals a high-risk acquisition source, a single provider that started deferring last Tuesday, or one agent mailing a directory it scraped three weeks ago. Most dashboards fold hard bounces, temporary deferrals, blocks and mailbox-full responses into a single percentage, which leaves an operator with a number and no diagnosis.
Say one agent pulls contacts from a scraped directory and runs a 6% hard-bounce rate, while the account total still reads 1.2% because the other mailboxes send to verified contacts. The account looks fine. One workflow is actively damaging the shared sending reputation, and the average is hiding it.
The Five Figures Worth Reporting
Replace the single number with five reported figures, each segmented by agent, campaign, recipient domain or provider, and sending window:
- Hard-bounce rate approximates invalid or unusable recipient inventory, so a rising trend points at stale or malformed data.
- Soft-bounce rate shows how much of the total is transient and likely to resolve on retry.
- Unknown-user rate isolates the specific rejection that means the mailbox doesn't exist, which is the cleanest signal of a bad source.
- Complaint rate catches the damage that bounces don't, because a suppressed address and an angry recipient are different failures.
- The denominator states how many messages the percentage is built from, without which none of the others can be compared.
That framing separates a bad workflow from a bad list, which a generic benchmark cannot do. A list problem shows up across every mailbox drawing on the same source. A workflow problem stays inside the agent that produced it.
Set a Baseline Per Mailbox
The fair test is a baseline for that mailbox, set over its first weeks of sending, with an alert when hard bounces rise above it. A mailbox that has never sent has no baseline, and comparing its first day against a company-wide average is how good agents get paused for no reason.
The fix belongs in the mailbox that produced the bounces. Suppress the permanent failures, slow or stop the source, and leave the mailboxes with clean sources running.
Common Causes of Bounces and How to Fix Each
| Symptom | Likely cause | Fix |
|---|---|---|
| Hard bounces jump after a new list import | Stale or malformed addresses from an old or scraped source | Validate addresses before sending and remove the source batch |
| Same address deferred again and again | Greylisting, throttling or a full mailbox | Bounded retries with backoff, then suppress |
| 5xx rejections from one provider | Provider policy or domain-level rejection | Slow sends to that provider and check DNS authentication records |
| Same contact bounces across several agents | Duplicate or conflicting outreach | Shared duplicate checks and contact leases |
| Bounces spike after an unattended run | Excessive volume or poor targeting | Send limits, cooldowns and a pause at the baseline breach |
A hard bounce that appears right after an import is the easiest case in the table, and the one most often handled by hand. Validate the addresses before the next send and pull the source batch out of the queue. That takes effect the same day, because the fix is a suppression list entry and a queue edit rather than a code change.
Repeated 4xx deferrals to a single address are a different problem wearing the same clothes. The address is probably fine and the receiving server is busy, so give the retries a budget with backoff and suppress only once it's exhausted. Deleting the contact on the first deferral throws away a deliverable recipient.
Clusters of 5xx rejections from one provider are the slowest to recover from. Slow the send rate to that provider and check the sending domain's authentication records, meaning SPF, DKIM and DMARC. Provider-level rejections often reflect a domain reputation judgment, so the fix is a change in behavior over days, not a suppression entry that resolves in minutes. Give it a week before concluding anything.
The same contact bouncing across several agents means the duplicate check isn't shared. Two mailboxes mailing one person from separate workflows generates confusion for the recipient and double bounces for you. A shared check plus a contact lease, so only one agent holds that address at a time, removes both.
Bounces that spike after an unattended overnight run are a volume problem. Set a daily send limit, add a cooldown between batches, and make the mailbox pause when the hard-bounce rate crosses its baseline. A hard bounce or a spam complaint suppresses that address at once in Molted Email, and three soft bounces within 30 days do the same.
Each of those fixes maps to a control you can set today: suppression for permanent failures, retry budgets for transient ones, send limits and cooldowns for volume, and a pause for anything that crosses a threshold. If a spike traces back to a prospecting pipeline that lives in a spreadsheet, connect prospecting workflows with Monday so the source list stays in one place and a bad batch can be pulled in one edit. For the wider set of sending controls that keep an agent out of trouble, email deliverability for AI agents goes deeper on how each one interacts.
Set Bounce Thresholds Before Your Agent Sends
Turn the numbers into a written policy for each mailbox, before the agent has a chance to send anything.
- Record a baseline. Two weeks of sending gives hard and soft rates for that mailbox. Everything afterward is measured against those figures.
- Confirm suppression is live. Permanent failures should leave the queue automatically, on the first rejection, not after someone reviews a report.
- Cap retries. Transient failures get a bounded number of attempts with backoff, and the address is suppressed once the budget runs out.
- Pause above the baseline. When hard bounces rise past it, stop that mailbox and find the source before resuming. Molted Email pauses a mailbox when its bounce or complaint rate rises, and only a person can resume it.
- Log the context. Agent, campaign and recipient source for every bounce, so an investigation starts with a filter instead of a spreadsheet reconstruction.
Each agent gets its own mailbox, so keep the baseline and the bounce counts separate per mailbox. A spike then traces to one agent's workflow instead of dissolving into an account average nobody can explain.
The same reasoning extends past bounce rates into the rest of the sending rules, which the policy rules that protect your sender reputation covers in more depth.
Start free at molted.email (free for people, paid plans from $19 a month).
Molted Email gives each agent its own address and inbox, so bounce counts stay attached to the workflow that produced them instead of dissolving into an account average. Mailboxes run on their own by default, approvals are an optional dial, and every outgoing message is checked against mailbox policy for duplicates, cooldowns, suppressions and sending limits before it leaves. Start free at Molted Email, free for people, with paid plans from $19 a month.